Climate change is a global problem caused by the cumulative warming effects of GHG emissions. Governments at all levels, non-governmental agencies, and private citizens and businesses are now acting to mitigate GHG emissions as quickly as possible to reduce or avoid the most catastrophic effects of climate change.
For a more detailed overview of climate change science and regulatory background information regarding GHG emissions, see Chapter 12, “Climate Change” in the General Plan Background Report.
As part of this General Plan update, a GHG emissions reduction strategy (GHG Strategy) was prepared and integrated with the General Plan and will be analyzed in the Program Environmental Impact Report (EIR). Section 6.9, “Greenhouse Gas Emissions”, in the Conservation and Open Space Element includes a goal and policy intended to frame the GHG Strategy and the County’s approach to addressing GHG emissions in the General Plan.
COS-10: To improve the long-term sustainability of the community through local efforts to reduce greenhouse gas (GHG) emissions.
COS-10.1 Greenhouse Gas (GHG) Reduction Strategy
The County shall maintain and refer to the General Plan and its integrated greenhouse gas (GHG) Reduction Strategy as the County’s comprehensive plan for reducing community-wide GHG emissions in the unincorporated County. (RDR)
The purpose of the GHG Strategy is to identify and reduce community GHG emissions from existing and future activities and sources within the unincorporated area. The GHG Strategy is consistent with the County’s commitment to address climate change and work towards a more sustainable community by reducing GHG emissions, pursuant to the General Plan Vision and Guiding Principles. The GHG Strategy also serves to identify the County’s local fair-share contribution to meeting statewide GHG emission reduction goals pursuant to state legislation, policies, and guidance.
The GHG Strategy is intended to function as a stand-alone GHG emissions reduction plan or “Climate Action Plan” (CAP). However, rather than having a separate stand-alone document, the GHG Strategy includes all the necessary components of a CAP and integrates them into the policy framework of the General Plan and technical analyses included within the associated General Plan Program EIR.
The GHG Strategy was prepared using the best-available guidance at the time the General Plan was prepared, including the latest GHG emissions accounting protocols applicable to a local community (i.e., the U.S. Community Protocol v1.1), California’s 2017 Climate Change Scoping Plan (2017 Scoping Plan) adopted by the California Air Resources Board (CARB), and the 2017 General Plan Guidelines and California Environmental Quality Act (CEQA) Guidelines published by the Governor’s Office of Planning and Research (OPR). The subject of climate change and GHG emissions mitigation continues to evolve rapidly in terms of both policy and technical methodology; thus, the County will need to monitor and update the GHG Strategy over time, as outlined in more detail in Section B.1.5.
The GHG Strategy satisfies the requirements of CEQA to identify and mitigate GHG emissions associated with the General Plan Update as part of the environmental review process. Thus, the GHG Strategy fulfills a regulatory obligation under CEQA to disclose and mitigate potential impacts.
Table B-1 summarizes the core components of the GHG Strategy, their locations in the General Plan and General Plan Program EIR, and relationship to the specific criteria outlined for a qualified “plan for the reduction of greenhouse gases” pursuant to section 15183.5 of the CEQA Guidelines. Each of the GHG Strategy components is described and summarized further below Table B-1.
Table B-1 Summary of GHG Strategy
| GHG Strategy Component | Policy Document Location(s) | General Plan EIR Location(s) | Corresponding GHG Reduction Plan Criteria per CEQA Guidelines Section 15183.5(b)(1) and (2) |
|---|---|---|---|
| Baseline GHG Emissions Inventory and Forecasts | Results of the GHG inventory and forecasts are summarized in Sections B.1.1 and B.1.2. | More detailed technical information regarding the baseline emissions inventory and forecasts, along with forecasts for 2020, 2030, 2040, and 2050 will be included in the GHG Section of the Program EIR and its technical appendices. | (1)(A) “Quantifies GHG emissions, existing and projected over a specified time period, resulting from activities within a defined geographic area.” (1)(C) “Identify and analyze the GHG emissions resulting from specific actions or categories of actions anticipated in the defined geographic area.” |
| GHG Emissions Reduction Goals and Targets | Policies COS-10.2 and COS-10.3 in the General Plan identify the County’s specific GHG emissions reduction goals and targets, consistent with state guidance and legislation. These goals and policies and the specific numerical mass emission levels required to achieve the goals and targets are also briefly summarized and described in Section B.1.3. | Detailed technical analysis and modeling results regarding how the targets and goals were calculated will be included in the GHG Section of the Program EIR and its technical appendices. | (1)(B) “Establish a level of GHG emissions, based on substantial evidence, below which the contribution to GHG emissions from activities covered by the plan would not be cumulatively considerable.” |
| GHG Emissions Reduction Measures | Policy COS-10.4 identifies the County’s commitment to implement goals, policies, and programs, included throughout the General Plan, that are considered part of the County’s GHG Strategy, and which contribute to reducing emissions and achieving the County’s targets and goals. Such goals, policies, and programs are tagged with the CAP icon to indicate that they are part of the GHG Strategy. Section B.1.4 provides a brief overview and tabular summary of these policies or programs, by emissions sector; and, for those measures for which quantification is feasible and appropriate, identifies the corresponding quantitative GHG reductions that would be achieved by the specified target or goal year(s). | The GHG Section of the Program EIR will also summarize the results of the GHG emissions reduction analysis and performance of the General Plan policies and programs in achieving the GHG reduction targets and goals. The quantitative GHG analysis will be part of the environmental impact analysis related to GHG emissions. Detailed technical analysis and modeling results for quantifying GHG reduction measures will be included in the technical appendix to the GHG Section of the Program EIR. | (1)(D) “Specify measures or a group of measures, including performance standards, that substantial evidence demonstrates if implemented on a project-by-project basis, would collectively achieve the specified emissions level.” |
| GHG Strategy Implementation and Monitoring Procedures | Implementation Programs A through F describe the County’s commitment and overall program to implement, monitor, report on, and update the GHG Strategy. Section B.1.5 provides more detailed description of the specific criteria and procedures to be used in carrying out the GHG Strategy implementation program. | The GHG Section of the Program EIR will summarize and consider the GHG Strategy, including procedures for implementation, monitoring, reporting, and updating the GHG Strategy. | (1)(E) “Establishes a mechanism to monitor the plan’s progress towards achieving the [GHG reduction] level and to require amendment if the plan is not achieving specified levels.” |
| Environmental Review of the GHG Strategy and General Plan | – – | The GHG Strategy will be included within the General Plan EIR Project Description and analyzed in the General Plan Program EIR. The General Plan and Program EIR will be made available for a public review and comment period. The General Plan and Program EIR will be brought forward for public hearings and adoption and/or certification by the Board of Supervisors. | (1)(F) “Be adopted in a public process following environmental review.” |
Notes: CEQA = California Environmental Quality Act; GHG = greenhouse gas; EIR = environmental impact report.
Source: Ascent Environmental, 2019
B.1.1. Baseline GHG Emissions Inventory
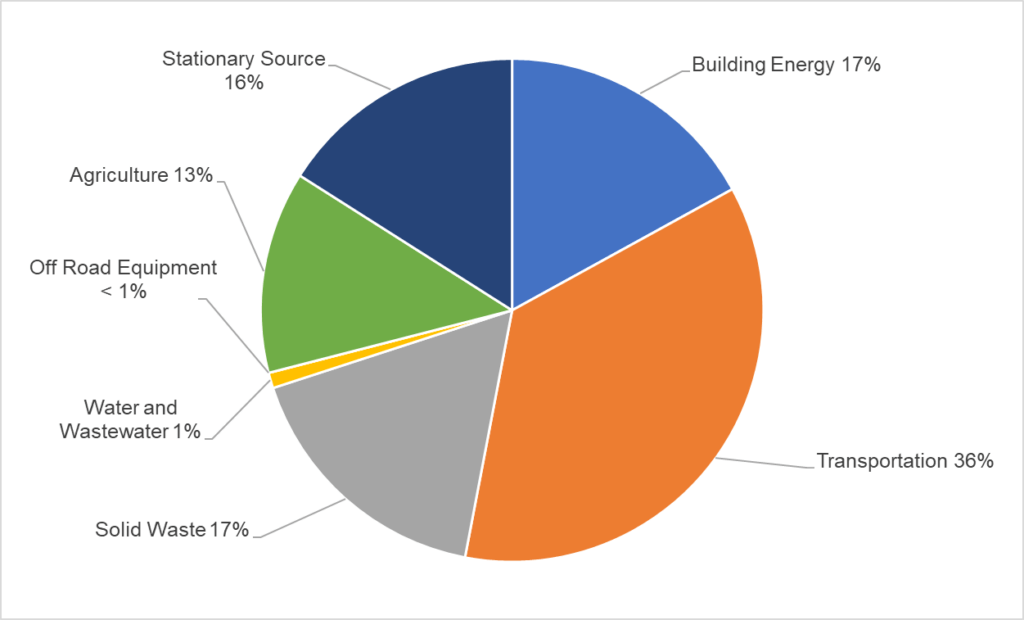
A GHG inventory was prepared for the County’s General Plan Update using a baseline year of 2015. The GHG inventory focused on community-wide emissions from residents and businesses operating within the unincorporated area and is organized by sector. The inventory includes sources within each sector that are under some degree of jurisdictional control by the County, in accordance with established GHG accounting protocols and state guidance. A 2015 baseline year was selected based on the availability of data in 2016, the year in which the inventorying process began. The total community-wide emissions for the unincorporated area in 2015 were approximately 1,939,238 metric tons (MT) of carbon dioxide equivalent (CO2e) GHG emissions. The GHG emission sectors and the percentage contribution of each sector to total emissions is shown in Figure B-1 and Table B-2.
Figure B-1 2015 Greenhouse Gas Emissions in Unincorporated Ventura County, by Sector
Source: Ventura County 2040 General Plan Final EIR.
Table B-2 2015 Greenhouse Gas Emissions in Unincorporated Ventura County
| Inventory Sector | Community GHG Emissions in 2015 (MT CO2e) | Percent of Total Communitywide GHG Emissions |
|---|---|---|
| Transportation | 692,753 | 35.7 |
| Building Energy | 322,048 | 16.6 |
| Solid Waste | 333,167 | 17.2 |
| Stationary Sources | 317,222 | 16.4 |
| Agricultural | 260,849 | 13.5 |
| Water and Wastewater | 13,148 | 0.7 |
| Off-road Equipment | 52 | < 0.1 |
| Total (all sectors) | 1,939,238 | 100 |
Notes: MT = Metric Tons, CO2e = Carbon Dioxide Equivalent, GHG = Greenhouse Gas. Sectors may not add to totals due to rounding.
Source: Ventura County 2040 General Plan Final EIR.
Consistent with OPR guidance, the inventory was prepared using the U.S. Community Protocol for Accounting and Reporting of Greenhouse Gas Emissions, Version 1.1 (International Council for Local Environmental Initiatives (ICLEI) 2013). Additionally, the inventory used global warming potential (GWP) values for methane (CH4) and nitrous oxide (N2O) consistent with the latest version of the Intergovernmental Panel on Climate Change Assessment Report 5 (IPCC AR5).
The 2015 inventory of GHG emissions is organized by the following seven sectors, presented in decreasing order by level of contribution. Summaries of each sector are included in the following paragraphs. For more detailed activity data, assumptions, and calculations used to develop the County’s GHG inventory, see Attachment 1 to Appendix B, Appendix D to the Draft EIR, Chapters 2 and 3 of the Final EIR, and Attachment 2 to the Final EIR.
Transportation
The transportation sector comprised the largest share of the inventory at 36 percent, or 692,753 MT CO2e. This sector includes on-road light and heavy-duty vehicles and buses operating on local roadways and passenger rail, including Amtrak and Metrolink lines, within the unincorporated area. On-road vehicle emissions were calculated using vehicle miles travelled (VMT) data provided by the Ventura County Transportation Commission (VCTC), which were adjusted using recommended methods from the Senate Bill 375 (2008) Regional Targets Advisory Committee (RTAC) and converted to GHGs using emissions factors from CARB’s Emissions Factor (EMFAC) model. For passenger rail transportation, annual trips were calculated for portions of the railway within the unincorporated area and converted to GHGs using statistics on locomotive engine efficiency published by Oak Ridge National Laboratories and default emissions factors for diesel combustion published by The Climate Registry. Freight rail, ocean freight, and aircraft were excluded from this inventory because the activities and emissions associated with these modes of transport are regulated by federal agencies; thus, they are outside of the County’s jurisdictional control.
Building Energy
The building energy sector comprised the second largest share of the inventory at 17 percent, or 322,048 MT CO2e. This sector includes electricity and natural gas consumption occurring in residential and commercial buildings and electricity consumption for agricultural uses including private irrigation pumping. The electricity and gas consumption data were provided by Southern California Edison (SCE) and Southern California Gas Company (SoCalGas) for the unincorporated area for 2015. Electricity consumption for industrial uses was not available due to the SCE’s aggregation rule for third party data requests, which limits the release of electricity consumption data for industrial facilities when a single customer’s data accounts for more than 25 percent of total aggregated data or if there are less than five accounts represented (SCE 2019).
Electricity consumption data for the described uses were converted to GHG emissions using calculated 2015 electricity generation emissions factors derived from SCE annual reporting for 2015 (SCE 2015a, 2015b) and the U.S. Environmental Protection Agency (EPA) Emissions & Generation Resource Integrated Database (eGRID) data. Natural Gas consumption data were converted to GHG emissions using default emissions factors for natural gas combustion published by The Climate Registry.
Solid Waste
The solid waste sector was the third largest sector of the inventory at 17 percent or 333,167 MT CO2e. This sector consists of two subsectors: 1) waste-in-place CH4 and N2O emissions generated from the decomposition of previously landfilled waste in existing landfills operating in the unincorporated area, and 2) CH4 emissions from waste generated annually by County residences and businesses at landfills in various locations. For both subsectors, GHG emissions were calculated using data on the tonnage of mixed solid waste disposed from annual reports submitted by waste facilities to state and federal agencies. The active Toland Road Landfill and Simi Valley Landfill and Recycling Center are the facilities generating the highest levels of emissions in the unincorporated area. Methods used to calculate emissions in this sector are further described in the 2040 General Plan Final EIR, pages 2-12 to 2-13.
Stationary Sources
Stationary sources comprised 16 percent of the inventory, or 317,222 MT CO2e. Methods used to calculate emissions in this sector are described in the 2040 General Plan Final EIR, pages 2-13 to 2-15.
Agriculture
Agricultural emissions comprised 13 percent of the inventory, or 260,849 MT CO2e. This sector includes a wide range of GHG-generating activities including crop burning, enteric fermentation, manure management, farm equipment operation, pesticide use, and fertilizer applications. Within this sector, fertilization of crops, including the application of urea and lime to soils, was responsible for the largest share of agricultural emissions at 152,168 MT CO2e followed by the operation of farm equipment at 67,829 MT CO2e.
Livestock, pesticide, and fertilizer data for calculating GHG emissions were based on the annual crop reports available from the Ventura County Department of Agriculture/Weights & Measures and county-level statistics for the agricultural sector available from the California Department of Pesticides and California Department of Food and Agriculture. For agricultural equipment the CARB OFFROAD model was used to determine 2015 emissions from a variety of activities associated with agricultural production including the operation of tractors, sprayers, mowers, combines, bailers, tillers and other off-road agricultural equipment. GHG emissions resulting from diesel-fueled irrigation pumping were calculated using 2015 diesel irrigation pump counts provided by the Ventura County Air Pollution Control District (VCAPCD), combined with diesel pump emission factors from CARB.
Water & Wastewater
Water-related emissions accounted for less than one percent of the GHG inventory at 13,148 MT CO2e. Activities analyzed in this sector included emissions resulting from energy use from the conveyance, delivery, and treatment of imported water and the treatment of wastewater. It was assumed that emissions related to the electricity used for groundwater extraction would already be accounted for in the Building Energy sector.
For imported water, supply and demand data provided by the County were translated into energy use, which was then converted to CO2e using the same emissions factors for SCE sourced electricity described in the Building Energy sector. For wastewater treatment, the primary source of emissions is fugitive CH4 from septic tanks and central sewer plants using anaerobic treatment methods.
Off-Road Equipment
Off-road equipment accounted for less than one percent of the GHG inventory at 52 MT CO2e. Activities contributing to these emissions included mobile emissions sources that include portable construction equipment, light commercial vehicles, forklifts, oil drilling equipment and transportation refrigeration units. Emissions from these sources were calculated using county-level results from CARB’s OFFROAD emissions model, scaled to the unincorporated county level using 2015 population and employment data available from the California Department of Finance and the Regional Market Trends report included in the draft Background Report for this General Plan update.
B.1.2. GHG Emissions Forecasts
GHG emissions forecasts provide an estimate of future emission levels based on both a continuation of current activities and projected growth and change in a community over time. Forecasts also account for current and future legislative actions from the state and federal government that are expected to reduce future emissions. Forecasts provide insights into the scale of local reductions needed to achieve the GHG emissions reduction targets in the future, accounting for both potential growth and legislative actions.
Business-as-Usual Forecast
The first step in the emissions forecast process is the preparation of a “business-as-usual” (BAU) forecast. A BAU forecast represents a “no further action” scenario which assumes that no additional efforts or legislative actions will be made to reduce GHG emissions in the future. The BAU forecast is based on growth projected trends in population, housing, employment, and transportation activity over time, consistent with County and regional projections. The BAU forecast does not account for GHG emissions reductions associated with local GHG reduction measures or additional legislative actions.
BAU forecasts were estimated for 2020, 2030, 2040 and 2050 using County-specific demographic and vehicle activity projections. These forecasts, along with percentage growth rates relative to 2015 for forecasted years, are presented in Table B-3. All growth rates are based on forecasts prepared by the Southern California Association of Governments (SCAG) in preparation for the 2020 Regional Transportation Plan and Sustainability Communities Strategy (SCAG 2017). SCAG population growth forecasts were included in Chapter 6 of the General Plan Alternatives Report presented to the Ventura County Board of Supervisors in 2018. Table B-4 summarizes the results of the BAU emissions forecast for unincorporated Ventura County.
Table B-3 Growth Forecast for Unincorporated Ventura County, 2020 to 2050
| 2015 | 2020 | 2030 | 2040 | 2050 | |||||
|---|---|---|---|---|---|---|---|---|---|
| Demographic | # | # | % increase from 2015 | # | % increase from 2015 | # | % increase from 2015 | # | % increase from 2015 |
| Population | 97,733 | 99,755 | 2.1 | 100,918 | 3.3 | 101,832 | 4.2 | 102,490 | 4.9 |
| Employment | 32,889 | 32,988 | 0.3 | 34,556 | 5.1 | 35,875 | 9.1 | 37,941 | 15.4 |
| Housing | 32,191 | 32,446 | 0.08 | 32,959 | 2.4 | 33,472 | 4.0 | 33,725 | 4.8 |
Notes: Employment and housing growth rates for 2040 and 2050 interpolated from reported years 2035 and 2045
Source: Calculated by Ascent Environmental using data provided by the Southern California Association of Governments (SCAG 2017)
Table B-4 “Business as Usual” Greenhouse Gas Emissions Forecast for Unincorporated Ventura County (MT CO2e)
| Sector | 2015 | 2020 | 2030 | 2040 | 2050 |
|---|---|---|---|---|---|
| Transportation | 692,753 | 704,364 | 727,433 | 750,452 | 773,467 |
| Building Energy | 322,048 | 323,803 | 334,079 | 343,129 | 354,565 |
| Solid Waste | 333,167 | 338,221 | 334,763 | 306,366 | 280,798 |
| Stationary Sources | 317,222 | 245,340 | 198,432 | 160,660 | 130,212 |
| Agricultural | 260,849 | 256,223 | 248,882 | 241,541 | 234,200 |
| Water and Wastewater | 13,148 | 13,420 | 13,576 | 13,699 | 13,788 |
| Off-road Equipment | 52 | 52 | 54 | 56 | 59 |
| Total BAU Emissions (all sectors) | 1,939,238 | 1,881,423 | 1,857,220 | 1,815,904 | 1,787,089 |
| Percent Change from 2015 Baseline | 3.0 | 4.2 | 6.4 | 7.8 |
Notes: Columns may not add to totals due to rounding. MT CO2e = metric tons carbon dioxide equivalent, BAU = business as usual
Source: Ventura County 2040 General Plan Final EIR.
Legislative Adjustments to BAU Forecast
The next step in the forecasting process is to adjust the BAU forecast to account for state and federal legislative actions that will reduce future emissions from activities within the unincorporated area, without any additional local government action. Legislative actions include existing or reasonably foreseeable regulations, programs, or a combination thereof that are required by state or federal legislation and will result in widespread mandatory reductions across various emissions sectors. Table B-5 describes the legislative reductions applied to the BAU forecasts, along with the affected sectors, while Table B-6 summarizes the quantified legislative reductions and adjustments to the BAU forecasts by year.
Table B-5 Summary of State Legislation for Greenhouse Gas Emissions Forecasts
| Source | State Legislation | Description | Applicable Sectors |
|---|---|---|---|
| State | SB 100 (2018) RPS Program and Zero- Carbon Electricity Standards | Requires California retail electricity providers to procure 33 percent of electricity from renewable sources by 2020, 50 percent renewable by 2026, 60 percent renewable by 2030, and 100 percent zero-carbon by 2045. | Building Energy, Water & Wastewater |
| State | CARB Oil and Natural Gas Regulations | Regulations adopted by CARB in March 2017 to reduce fugitive and vented emissions1 of methane from new and existing oil and gas facilities. | Stationary Sources |
| State | AB 341 (2011) Solid Waste Diversion | Requires California to achieve a 75 percent reduction in solid waste disposal to landfills by 2020, through a combination of waste avoidance, recycling and composting of wastes generated by commercial and multi-family residential land uses. | Solid Waste |
| State | SB 1383 (2016) Organic Waste Regulations (Pending)3 | Sets targets for organic waste reduction from landfill disposal, including 50 percent of 2014 levels by 2020 and 75 percent of 2014 levels by 2025. The regulations will implement a portion of the state’s legislatively mandated Short-Lived Climate Pollutant (SLCP) Reduction Strategy. SLCPs are high GWP2 gases that remain in the atmosphere for a much shorter period than longer-lived climate pollutants, such as CO2. The SLCP addressed by this legislation is CH4. | Solid Waste |
| State | AB 1493 (2002) Clean Car Standards | Establishes GHG emission reduction standards for model years 2009 through 2016 that are more stringent than federal CAFE standards. | Transportation |
| State | CARB Advanced Clean Car Standards (2012). Regulatory update to AB 1493 (2002) Standards | Establishes GHG emission reduction standards for model years 2017 through 2025 that are more stringent than federal CAFE standards. | Transportation |
Notes:
1 Vented emissions include methane that is released due to equipment design or operational procedures.
2 Global Warming Potential: values that apply a weight to gases that are determined by researchers to have increased greenhouse gas effects relative to most common greenhouse gas, carbon dioxide.
2 SB 1383 regulatory proceedings are currently underway with adoption expected in late 2019.
RPS = Renewables Portfolio Standard, SB=Senate Bill, AB= Assembly Bill, CARB = California Air Resources Board, CAFE = Corporate Average Fuel Economy, GHG = Greenhouse Gas, SLCP = Short Lived Climate Pollutant, CH4 = Methane, CO2 = Carbon Dioxide.
Source: Ascent Environmental, 2019
Table B-6 Legislative Adjustments to BAU Greenhouse Gas Emissions Forecast for Unincorporated Ventura County, by Sector (MT CO2e)
| Sector | 2015 | 2020 | 2030 | 2040 | 2050 |
|---|---|---|---|---|---|
| Total BAU Emissions (all sectors) | 1,939,238 | 1,881,423 | 1,857,220 | 1,815,904 | 1,787,089 |
| Total GHG Reductions from Legislative Adjustments | 0 | -108,886 | -307,698 | -440,006 | -498,197 |
| Adjusted BAU | 1,939,238 | 1,772,537 | 1,549,522 | 1,375,898 | 1,288,892 |
| Percent Decrease in GHGs from BAU | 0 | -6 | -17 | -24 | -28 |
Notes: BAU = business-as-usual, GHG = greenhouse gas. Negative values.
Source: Ventura County 2040 General Plan Final EIR.
B.1.3. GHG Reduction Goals and Targets
GHG reduction goals and targets in a local GHG reduction plan help to define measurable benchmarks to guide the community’s commitment to achieve emissions reductions in the future. GHG targets and goals are developed relative to baseline emissions levels, and in consideration of future emission forecasts and the effect of ongoing or future legislative actions.
The County’s GHG reduction targets are set at 10-year intervals that are aligned with the state’s GHG reduction targets for 2020 and 2030, the 2040 horizon year for the County’s General Plan, and a longer-term state policy goal for 2050. An overview of the statewide context for target- and goal-setting, followed by a description of the County’s specific GHG targets and goals, is included below.
Statewide GHG Reduction Goals and Targets
As directed in Assembly Bill (AB) 32 (2006), Senate Bill (SB) 32 (2016), and Executive Orders (EOs) B-30-15 and S-3-05, the State aims to reduce annual statewide GHG emissions to:
- 1990 levels by 2020,
- 40 percent below 1990 levels by 2030, and
- 80 percent below 1990 levels by 2050.
AB 32 (2006), directed CARB to develop a Scoping Plan outlining a pathway to meeting the state’s 2020 target, which CARB adopted in 2008. The first update occurred in 2013 and indicated that reducing the state’s emissions to 80 percent below 1990 levels by 2050 would be consistent with the IPCC’s analysis of the global emissions trajectory needed to stabilize atmospheric concentrations at 350 parts per million (ppm) or less, to reduce the likelihood of catastrophic global climate change (CARB 2014). Thus, the statutory targets established by AB 32 (2006) and SB 32 (2016), identify interim targets on a downward trajectory towards achieving the longer-term 2050 goal. The state has not yet adopted a Scoping Plan that demonstrates a specific pathway to achieve the longer-term 2050 goal. Accordingly, the term “target” is used to describe future levels of GHG emissions that must be achieved to align with legislative mandates. The term “goal” is used to describe future levels of GHG emissions in the unincorporated area that are aligned with statewide long-term goals established under EOs, but for which no legislative mandate or statewide plan to achieve such goals has been established.
To determine an equivalent set of reduction targets and longer-term goals at the local level, CARB’s 2017 Scoping Plan recommends that local agencies establish community-wide GHG reduction goals for local climate action of GHG reduction plans that will help the state achieve its 2030 target and longer-term 2050 goal. CARB notes that it is appropriate to derive evidence-based targets or goals that are based on local emissions sectors and population projections that are consistent with the framework used to develop the statewide targets. CARB also notes that GHG goals and targets should show a “downward trend consistent with the statewide objectives.” (CARB 2017).
To meet the Scoping Plan recommendation, the GHG reduction targets included in the General Plan are based on local levels of GHG emissions that would be proportional to the statewide reductions needed to achieve GHG emissions by 40 and 80 percent below 1990 levels by 2030 and 2050, respectively. While the County does not have a 1990 GHG inventory from which to estimate GHG reductions, equivalent targets and goals were calculated for the County relative to the state’s 2015 statewide baseline and targets. Specifically, the state’s 2015 GHG emissions inventory was compared to the state’s 2020, 2030, and 2050 mass emissions goals relative to its 1990 inventory, from which specific percent reductions relative to 2015 were developed. Therefore, consistent with and proportional to the state’s target and goals relative to 2015 levels, the County’s targets are expressed according to the following percentage reductions in GHG emissions relative to the County’s 2015 community-wide GHG emissions levels:
- 2 percent below 2015 levels by 2020,
- 41 percent below 2015 levels by 2030,
- 61 percent below 2015 levels by 2040, and
- 80 percent below 2015 levels by 2050.
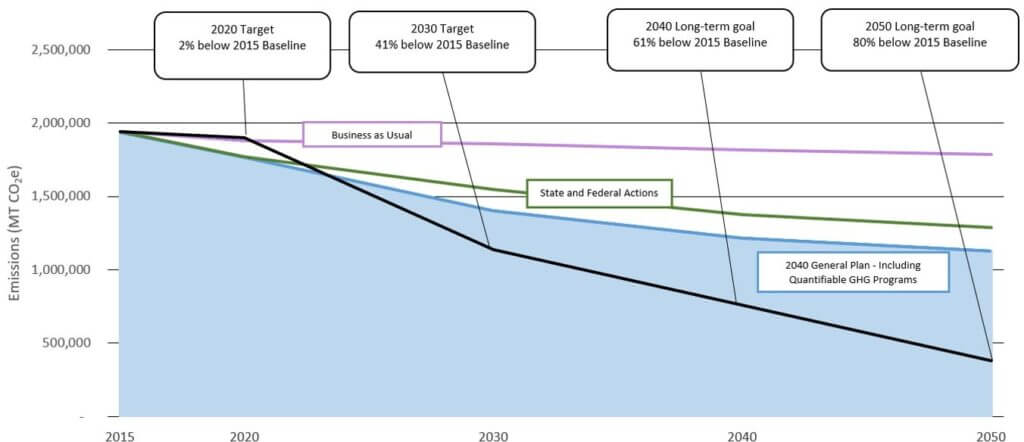
These targets and goals are also expressed numerically in Table B-7 in terms of levels mass emissions required relative to the 2015 baseline, while Figure B-2 graphically depicts the targets and goals relative to both baseline and legislative-adjusted emissions forecasts for the corresponding years.
The GHG Strategy is primarily focused on achieving the 2030 target and making substantial progress in achieving the longer-term post-2030 goals. The updated General Plan will not be adopted until 2020; therefore, the 2020 target is illustrative and shown for statewide target comparison purposes only. Under the legislative-adjusted forecast, unincorporated Ventura County is already on track to meet and exceed the 2020 reduction target by 125,310 MT CO2e, as shown in Table B-7 and Figure B-2. However, by 2030 a “gap” will begin to develop between the legislatively adjusted forecast emissions level and the mass emissions level needed to achieve the 2030 target. This gap becomes larger in 2040 and 2050. Thus, achievement of the 2030 targets and long-term 2040 and 2050 goals will require the implementation of locally enacted GHG reduction measures, along with ongoing updates to CARB’s Scoping Plan and future state and federal actions.
Table B-7 Community Greenhouse Gas Emissions Reduction Targets and Long-Term Goals for Unincorporated Ventura County
| Emissions (MT CO2e) | 2020 | 2030 | 2040 | 2050 |
|---|---|---|---|---|
| BAU Emissions with Legislative Reductions | 1,772,537 | 1,549,522 | 1,375,898 | 1,288,892 |
| Target for Consistency with State Climate Policy | 1,897,847 | 1,138,708 | 759,139 | 379,569 |
| Reductions Needed to Meet Targets | 125,310 | -410,813 | -616,760 | -909,323 |
Notes: Positive figures for reductions needed to meet targets in 2020 indicate that the County is on track to exceed targets due to near-term GHG reductions from state legislation. BAU = business as usual, MT CO2e = metric tons carbon dioxide equivalent
Source: Ventura County 2040 General Plan Final Environmental Impact Report. (CARB 2018)
Figure B-2 Community Legislative-Adjusted Business-as-Usual Greenhouse Gas Emissions Forecast and Reduction Targets and Goals
Source: Ascent Environmental, 2020
The 2030 target and longer-term 2040 and 2050 goals are included as policies in the General Plan, as follows:
COS-10.2 Community Greenhouse Gas Emissions Reduction Target for 2030
The County shall work toward achieving a community-wide GHG emissions reduction target of 41 percent below 2015 levels by 2030. RDR
COS-10.3 Community Greenhouse Gas Emissions Reduction Goals for 2040 and 2050
The County shall work toward achieving longer-term, post-2030 community-wide GHG emissions reduction goals, as follows:
- 61 percent below 2015 levels by 2040, and
- 80 percent below 2015 levels by 2050.
RDR
B.1.4. GHG Reduction Measures
Specific General Plan policies and programs have been identified throughout the General Plan that will reduce GHG emissions and/or are part of the County’s integrated GHG Strategy. These specific goals, policies, and programs are tagged with a symbol in each of the Elements of the main body of the General Plan. Those policies and programs that reduce GHG emissions are considered “GHG reduction measures”. This is consistent with Policy COS-10.4, which states:
COS-10.4 Greenhouse Gas Reductions in Existing and New Development
The County shall reduce GHG emissions in both existing and new development through a combination of measures included in the GHG Strategy, which includes new and modified regulations, financing and incentive-based programs, community outreach and education programs, partnerships with local or regional agencies, and other related actions. (RDR)
The GHG reduction goals, policies, and implementation programs are summarized and presented in Table B-10 (presented Section B.3 of this appendix).
The GHG reduction measures apply to existing sources of emissions in the unincorporated area subject to the County’s land use authority, as well as net increases in emission associated with forecasted growth.
Some of the GHG reduction measures are qualitative in nature because either the methods or data required to quantify GHG reduction are unavailable. In such cases, measure-specific GHG reductions are not shown; however, this does not mean that qualitative measures are not important or should not be considered in the GHG Strategy. Many community-wide CAPs or GHG reduction plans include qualitative measures that, while difficult to quantify on a broad planning level, may still be highly effective at the project or individual site (i.e., household or business) level. This is particularly true for individual or community-driven actions that encourage behavior or lifestyle change through education, outreach, incentives, or other programs. Such measures are often considered critical to increasing community buy-in and participation. Many GHG reduction measures also have important complimentary benefits, such as improving public health, improving air quality, creating jobs, and improving overall quality of life. The County recognizes the linkages between health, climate action, and overall sustainability and resilience in the community, and thus a diverse range of GHG-reducing measures are included in the GHG Strategy.
B.1.5. GHG Strategy Implementation and Monitoring
The County’s approach to implementation and monitoring of the GHG Strategy will be coordinated with overall implementation and monitoring of the General Plan. However, the County will implement specific programs outlined herein to ensure that the specific components of the GHG Strategy are working together to achieve the General Plan’s targets, goals, and other beneficial outcomes related to climate change and sustainability.
GHG Implementation Programs
GHG implementation programs provide pathways to attain the specific qualitative and quantitative GHG reductions for policies contained in the General Plan. These programs vary considerably, depending on the method, timing, and individual approach. Some GHG reduction policies are programmatic in nature and require further study or subsequent action to fund, develop and implement a new program, form a new partnership, or engage with or support the efforts of other agencies or organizations. Other GHG programs are regulatory in nature and would require the County to amend codes, standards, or specifications and would be implemented through the development review and permitting process. Table B-8 summarizes the implementation programs contained in the plan that are designed to support the plan’s GHG reduction policies.
Table B-8 GHG Implementation Programs
GHG Implementation Program – Monitoring and Reporting
To ensure that the County’s GHG Strategy is on track to achieve the GHG emissions reduction targets and goals GHG implementation programs have been developed specifically for monitoring the performance of the GHG strategy. The County will implement, monitor, and update the GHG Strategy as described in the GHG Strategy Implementation and Monitoring programs shown in Table B-9.
